
Key Takeaways
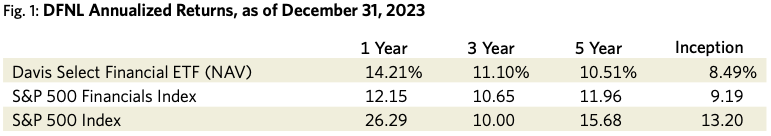
- The S&P 500 Index ended 2023 up +26.29%. The S&P Financials Index lagged the broad index’s performance at a gain of +12.15%, with regional banks specifically dragging the result. Davis Select Financial ETF outperformed the S&P Financials Index with a return of +14.21%.
- In spring 2023, the changing interest rate environment revealed a handful of banks that had overreached on duration risk when rates were low. This prompted fearful customers to withdraw deposits and ultimately led to several bank failures.
- Investor sentiment about the economy, interest rates and credit improved dramatically toward the end of the year, driving a recovery in bank stock prices from their mid-year declines.
- We believe that our banks are well-positioned to withstand an eventual recessionary environment. Though short-term market fluctuations are unpredictable, our companies’ valuations are sufficiently low that we think they should be able to generate strong returns over the next decade.
The average annual total returns for Davis Select Financial ETF for periods ending December 31, 2023, are: NAV Return, 1 year, 14.21%; 5 years, 10.51%; Inception (1/11/17), 8.49%; Market Price Return, 1 year, 14.44%; 5 years, 10.69%; Inception, 8.51%. The performance presented represents past performance and is not a guarantee of future results. Investment return and principal value will vary so that, when redeemed, an investor’s shares may be worth more or less than their original cost. For the Fund’s most recent month end performance, visit davisetfs.com or call 800-279-0279. Current performance may be lower or higher than the performance quoted. NAV prices are used to calculate market price performance prior to the date when the Fund was first publicly traded. Market performance is determined using the closing price at 4:00 pm Eastern time, when the NAV is typically calculated. Market performance does not represent the returns you would receive if you traded shares at other times. The total annual operating expense ratio as of the most recent prospectus was 0.63%. The total annual operating expense ratio may vary in future years.
This material includes candid statements and observations regarding investment strategies, individual securities, and economic and market conditions; however, there is no guarantee that these statements, opinions or forecasts will prove to be correct. All fund performance discussed within this piece are at NAV and are as of 12/31/23 unless otherwise noted. This is not a recommendation to buy, sell or hold any specific security. Past performance is not a guarantee of future results. Equity markets are volatile and an investor may lose money.
Strategy
Since its inception, Davis Select Financial ETF (DFNL) has invested in durable, well-managed financial services companies at value prices, which the fund could hold for the long-term. Shelby Cullom Davis’s quip that financial services companies can be “growth companies in disguise” remains a bedrock tenet of our approach. Investors tend to place low valuations on financial companies because of their earnings volatility. But many financial companies generate capital through the business cycle at an attractive rate, which they use to pay dividends, buy back stock or otherwise deploy in ways that generate shareholder value.
Results
The S&P 500 Index ended 2023 up +26.29%, its performance driven by its seven large technology holdings, which in aggregate increased +76% and now sport an $11 trillion market capitalization and comprise approximately 28% of the index. In contrast, the equal-weighted S&P 500 Index increased by only +14%. While it was undoubtedly a good year for stocks in general, 2023 was also striking for its level of dispersion in returns.
The S&P Financials Index returned a gain of +12.15%, well off the pace of the S&P 500 Index but almost on par with the equal weighted index. Regional banks were a drag on the S&P Financials Index result. Banks experienced a dramatic drawdown in early March, ignited by solvency concerns at Silicon Valley Bank that led to a run on its deposits, and ultimately to resolution by the FDIC. The S&P Financials Index, and banks in particular, performed well into the end of the year, clawing back some of the earlier underperformance versus the broader indices on an improving outlook for a “soft landing” and the easing of interest rates in 2024.
DFNL outperformed the S&P Financials Index with a return of +14.21%. Our biggest contributors to relative performance were in consumer finance (Capital One Financial, Rocket Companies and American Express), Danske Bank and our largest U.S. bank positions (Wells Fargo and JP Morgan Chase). The fund’s largest detractors were Bank of America and Charles Schwab.
What Happened in Banking?
Banks, globally and broadly defined—including trust banks and wealth-management firms taking on-balance-sheet client deposits but little credit risk—make up slightly more than 70% of DFNL. We continue to think many investors remain leery of financial stocks (and banks in particular) with memories of the 2008–09 financial crisis still vivid. This appears to have been the case in 2023, as for much of the year the market prices for banks were weighed down by concerns over interest rates, credit and regulation.
Banks had been under-earning for years owing to the low level of interest rates. With rates at zero, they were unable to earn a spread on their customers’ deposits. This situation dramatically changed as the U.S. Federal Reserve began increasing short-term interest rates in spring 2022, now standing at 5.25% at the lower bound. Most banks have experienced a significant increase in net interest income as their floating-rate assets repriced immediately, while their deposit funding costs only moved at 30–40% of the change in short-term interest rates. Indeed, the aggregate net interest income of our largest U.S. bank holdings1 has increased +48%, and most of this has dropped to the bottom line.
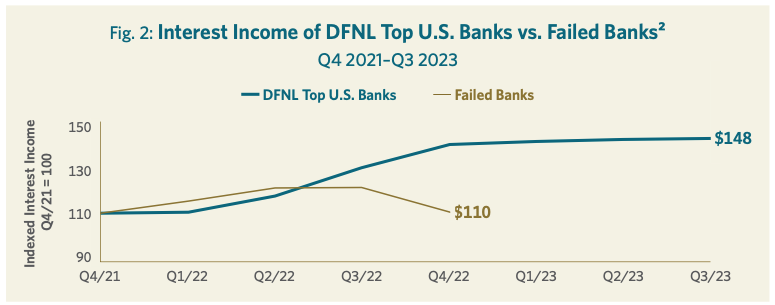
The shock of rapidly rising interest rates revealed that some banks were not so well-positioned to benefit—in particular Silicon Valley Bank, First Republic Bank and Signature Bank, all of which failed and had to be resolved by the FDIC (and none of which we owned). This represented an incredible mismanagement of duration matching between their assets and liabilities. These banks took on considerable duration risk when rates were low (presumably to prop up interest income and earnings), and they seemingly misunderstood the stickiness of their deposit franchises. As we wrote in our mid-year letter, all banks will experience mark-to-market losses on their fixed-rate assets in a rising rate environment, but their customer deposit balances are also worth considerably more given that the rate paid on them is far less than the going market rate of interest. The key is to strike the right balance, acknowledging that the duration of deposits is behavioral, not contractual. As an indication of just how much of an outlier the failed banks were compared to most others, this group saw their net interest income peak as early as mid-2022, and by the end of that year were experiencing an accelerated decline in interest income. (See Figure 2.)
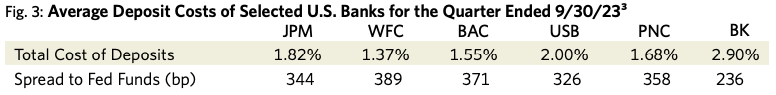
These bank failures did have knock-on effects onto banks in general (including those we own), both from a market- and (to a lesser degree) intrinsic-value perspective. At its trough in early May when contagion fears remained high, the S&P Banks Select Industry Index was down -29% from the end of 2022. While those fears did abate, the experience has changed some market participants’ perspective about the value of deposit franchises, and arguably has resulted in higher deposit funding costs than had been anticipated. That said, U.S. banks continue to pay out on their deposits at well below the market rate of interest, which drives highly attractive returns to their deposit-gathering activities. (See Figure 3.)
On credit, bank stock prices were discounting two sources of potential aggravation: 1) idiosyncratic losses in commercial office real estate (CORE), and 2) broader losses attributable to “normalization” and a slowing economy. In commercial office real estate, banks are only beginning to see rising defaults and delinquencies, as their tenants continue to pay rent on their long-term leases that have yet to expire. But banks have been proactive about placing these loans on nonperforming status in advance of experiencing actual delinquencies, and about reserving for the related expected credit losses. At our U.S. banks with nontrivial commercial office real estate exposure,4 the aggregate allowance for credit losses on all commercial real estate (CRE) increased by $2.4 billion through the first nine months of 2023. The vast majority of these losses is attributable to commercial office (and is equivalent to approximately 4.4% of commercial office loans outstanding). The average ratio of allowances-to-loans for CORE (for those who disclose it) now stands at approximately 10%. While management estimates can of course be wrong, they are required to set their allowances to cover all expected credit losses over the life of each loan—which is to say, from an accounting perspective, that the eventual fallout from the dramatic changes taking place in commercial office real estate should (in theory) already be “over.”
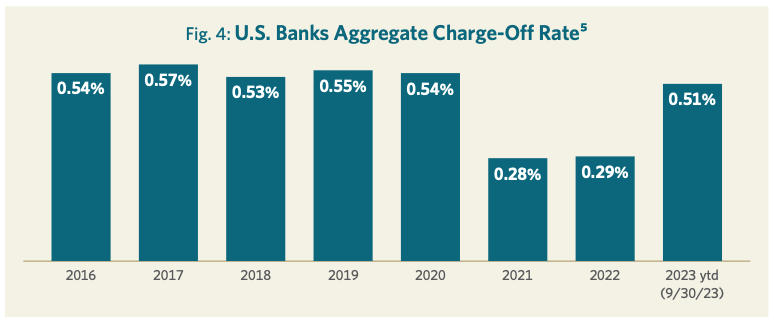
Looking more broadly at credit, losses have been “normalizing” this year, albeit from a very low base. It would be abnormal if this didn’t occur. The largest U.S. bank holdings in DFNL experienced charge-offs at an annualized rate of 0.51% through the first nine months of 2023, nearly double the pace of 2021–2022, but still modestly below the pre-COVID-19 years. We try to avoid making forecasts about macroeconomic variables, but we’ve always assumed that our companies would need to live through a recession at some point during our holding period. When that day comes—whether some time next year or further in the future—it is quite plausible that charge-off rates will rise above this pre-COVID trend level for a period of time. After all it’s a cyclical business. What is more important is how well prepared the companies are to get through it.
Beyond the quality of a loan’s initial underwriting—which can vary enormously between and within institutions based on terms, conditions, appraisals, collateral, recourse and the like—banks have three lines of defense in a deteriorating credit environment: 1) their allowances for loan losses that have already been booked—which, as discussed above with respect to CORE, should already reflect lifetime expected credit losses; 2) their pre-provision earnings, which can absorb credit losses as they materialize and 3) their capital—which today is approximately twice the level it was before the financial crisis of 2008. One way to assess this question is to look at the Federal Reserve’s own bank stress tests. These same eight banks are modeled to generate pre-tax losses over the 2.25 year forecast period equivalent to 10% of their initial equity capital.6 That is in a “severely adverse” scenario that contemplates unemployment rising to 10% and a -40% decline in all commercial real estate values, resulting in annualized credit losses of 2.9% over the forecast period. Obviously, this is not an outcome that bank investors would be pleased about, but it would seem to be far from fatal. In a more “typical” recession, by definition their credit losses would be far less painful.
On regulation, during the past summer the Federal Reserve in conjunction with various other bank regulators published its proposed changes to the capital rules. While it had been anticipated for quite some time, the consensus among investors was that the proposals were more onerous than expected. The regulators estimated that, as proposed, the required level of common equity capital would increase by +16% in aggregate.7 This is not an “across the board” figure however. By our reading, the impacts on capital are the greatest to a company’s investment-banking activities and its size (generally). For most regional banks the impact on required capital would likely be a modest mid-single-digit percentage increase only. The impact on intrinsic value of the proposed capital rules is less clear. To be sure, all else being equal, banks’ return on equity (ROE) will decline point-for-point with the increase in capital, which ought likewise to depress intrinsic value. Banks will respond to the new set of incentives however, in some cases passing on their higher capital cost to their customers where they can, and in other cases withdrawing from marginal business (freeing up the capital currently attributed to it). Still, it seems probable to us that banks wouldn’t be able to fully offset the impact of the proposed rules, and that ROE would compress relative to prior expectations; but they also would be less leveraged, so arguably less risky. Whether that will result in the market ascribing higher earnings multiples to banks remains to be seen. It has long been our view that banks today deserve a higher earnings multiple than they did prior to 2008 when they carried far less capital, but admittedly the newly proposed rules are rather onerous to certain lines of business.
Toward the end of the year, market sentiment on all of these fronts seems to have improved. Readings of inflation in the U.S. have trended down, which might give the Federal Reserve cover to start lowering short-term interest rates in 2024, and perhaps permit the economy to make the rarely seen “soft landing.” Long-term Treasury yields have also come in meaningfully—e.g., the ten-year bond yield at 3.9% is approximately 110 basis points8 lower from its peak in mid-October—which will ease the pressure on bank balance sheets from unrealized securities losses. There are some hints that the proposed capital rule changes may be scaled back. Stock prices have responded favorably, with the S&P Financials Index up +17% and the S&P Banks Select Industry Index up +31% since the end of October.
Despite the strong absolute returns generated by DFNL in 2023, we continue to view our holdings, particularly our bank positions, as quite attractively valued—a conviction we supported during the year by allocating additional fund capital to them. Our eight largest U.S. bank holdings are valued in aggregate at 1.5x tangible book value. These companies are expected to earn a 14% ROE in 2023.9 Admittedly, these banks probably “over-earned” modestly this year as credit has yet to normalize fully and average interest spreads were wide. But we believe this group should be able to earn a mid-teens ROE on average and over time.
Conclusion
We remain consistent in our approach to allocating capital in our portfolio. We look for companies with durable competitive advantages coupled with competent and honest managements that are priced at a discount to their intrinsic value. We invest presuming that we will own our companies through business cycles. We do not attempt to build a portfolio around a particular speculative forecast—by trying to predict where interest rates or the economy will go, for example. Rather, we strive to construct a portfolio that will perform well over the long term across a range of economic outcomes. As such, our portfolio is diversified across leading franchises earning above-average returns on capital in banking, payments, custody, wealth management and property and casualty insurance.
Investors’ worst fears regarding potential future recession and mismanagement of interest rate risk seem to have abated as we exited the year. We don’t pretend to know the future direction of macroeconomic variables, and would still consider a recession in the next year or two as quite plausible. However, we believe that banks—especially the banks in our portfolio—are well-positioned to withstand a recessionary environment, if and when that should that occur. And, despite the recovery in stock prices in the last months of 2023, we believe our companies’ valuations remain low enough to generate strong returns over the next decade.
We remain excited by the investment prospects for the companies in DFNL. Nothing provides a stronger indication of that than the fact that the Davis family and colleagues have a meaningful investment in the fund alongside our clients.10 We are grateful for the trust you have placed in us.
DFNL Davis Select Financial ETF
Annual Review 2024
Managers