
Key Takeaways
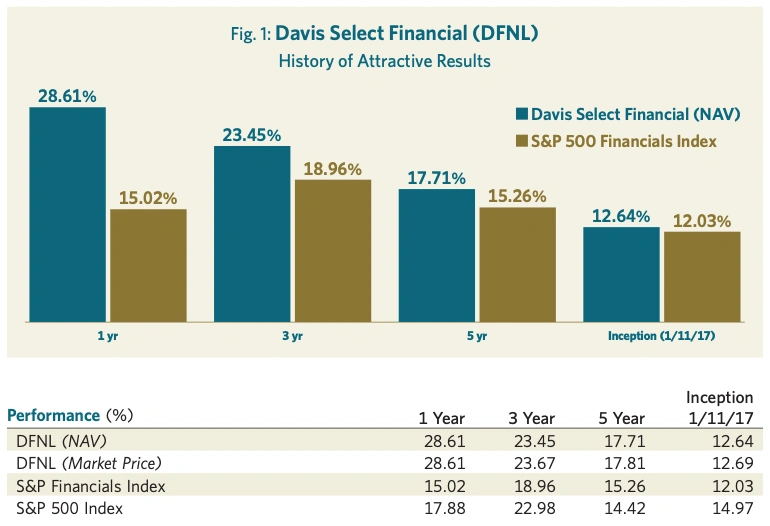
- Davis Select Financial ETF (DFNL) outperformed the S&P Financials Index for the 1-, 3-, 5- year periods and since inception.
- DFNL returned +28.61% in 2025, exceeding the performance of the S&P Financials Index which returned +15.02% and the S&P 500 Index, which returned +17.88%.
- Banking, consumer lending and capital markets stocks performed well, supported by tailwinds across credit, spreads, expenses, and regulation. Investor sentiment towards financial stocks—in our view, long weighted down by memories of the financial crisis—may finally be improving.
- We believe our portfolio companies’ valuations remain sufficiently low to provide for attractive returns over the next decade, and are particularly attractive on a relative basis versus the broader market.
The average annual total returns for Davis Select Financial ETF for periods ending December 31, 2025, are: NAV Return, 1 Year, 28.61%; 5 Years, 17.71%; Inception (1/11/17), 12.64%; Market Price Return, 1 Year, 28.61%; 5 Years, 17.81%; Inception, 12.69%. The performance presented represents past performance and is not a guarantee of future results. Investment return and principal value will vary so that, when redeemed, an investor’s shares may be worth more or less than their original cost. For the Fund’s most recent month end performance, visit davisetfs.com or call 800-279-0279. Current performance may be lower or higher than the performance quoted. NAV prices are used to calculate market price performance prior to the date when the Fund was first publicly traded. Market performance is determined using the closing price at 4:00 pm Eastern time, when the NAV is typically calculated. Market performance does not represent the returns you would receive if you traded shares at other times. The total annual operating expense ratio as of the most recent prospectus was 0.63%. The total annual operating expense ratio may vary in future years.
This material includes candid statements and observations regarding investment strategies, individual securities, and economic and market conditions; however, there is no guarantee that these statements, opinions or forecasts will prove to be correct. All fund performance discussed within this material are at NAV and are as of 12/31/25, unless otherwise noted. This is not a recommendation to buy, sell or hold any specific security. Past performance is not a guarantee of future results. There is no guarantee that the Fund performance will be positive as equity markets are volatile and an investor may lose money.
Strategy:
Growth in Disguise
Since its inception, DFNL has invested in durable, well-managed financial services companies at value prices which the portfolio could hold for the long-term. Shelby Cullom Davis’s quip that financial services companies can be “growth companies in disguise” remains a bedrock tenet of our approach. Investors tend to place low valuations on financial companies because of their earnings volatility. However, many financial companies generate capital through the business cycle at an attractive rate which they use to pay dividends, buy back stock or otherwise deploy in ways that increase shareholder value. As Figure 1 shows, DFNL outperformed the S&P Financials Index for the 1-, 3-, 5- year periods and since inception. This serves as a powerful reminder of the value active management can provide over a passive index.
2025 Results
The S&P 500 Index returned +17.88% in 2025. It experienced a -19% peak-to-trough drawdown early in the year driven by fear and uncertainty principally around U.S. trade policy, but by the end of the year equity markets had stormed back and then some, making it the third year in a row of exceptional investment returns. While the U.S. has imposed its highest level of tariffs in decades, the impact on economic activity—at least so far—has been muted, and markets seem to have shrugged it off. Continued enthusiasm for the promise of artificial intelligence (AI), and the immense capital expenditures that go with it, drove further stock market gains for many technology companies.
The S&P Financials Index returned +15.02% in 2025. The index return was driven by its large banks, capital markets firms and consumer lending companies. Its laggards included alternative asset managers, select payments companies and insurance brokers.
As noted, DFNL outperformed both indices with a return of +28.61%. The biggest contributors to our relative performance were our payments and consumer lending companies (Capital One, American Express and Rocket Companies), foreign banks (Danske Bank, DBS Group and DNB Bank), selected U.S. banks (JPMorgan Chase and Wells Fargo) and capital markets companies (BNY Mellon and Julius Baer). The portfolio’s largest detractors from relative performance were its holding companies (Berkshire Hathaway and Exor).
Market Environment:
A Sentiment Inflection Point?
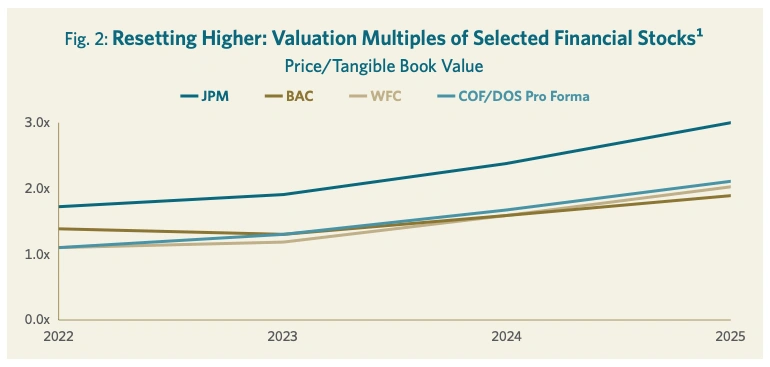
We have observed frequently in these letters that we believed the valuations of financial stocks, and banks in particular, have been weighed down by the leeriness of investors with still-vivid memories of the 2008–09 financial crisis. With 2025 being the third year in a row of strong returns for financial stocks it may well mark the year that investors finally started warming up to the sector. The S&P Financials Index still lagged the performance of the broader market in 2025, and continues to trade at an historically deep discount as measured by price/earnings ratios. However, in absolute terms investment returns on financial stocks were strong in 2025, and their valuations have begun to reset higher.
The reset in valuations can be observed in Figure 2 showing trends in the price-to-tangible book value multiple of several leading financial institutions. This multiple has expanded by over 70% on a simple average basis in the past three years, a period which included the regional banking crisis of 2023. If prices convey information, the implication of this market move should reflect some combination of the following: book values are perceived to be more “solid” (i.e., there aren’t as yet unrecognized credit losses suspected around the corner), the outlook for business growth has improved, there has been a step-up in the expected long-term profitability of the businesses (i.e., higher returns on equity, including from any reductions in capital requirements), and/or the market has reduced the rate of return investors require of these stocks in discounting their future cash flows (which is to say, investor sentiment towards the group is improving).
We think probably all these factors have helped drive market returns in financial stocks, particularly banks, as there have been tailwinds across multiple dimensions. With respect to credit, the trends have been largely stable. Consumer-related losses have “normalized” upward from their low levels in the aftermath of COVID but are still trending better today than a year ago. Commercial non-performing loans on bank balance sheets have remained low and steady (despite a few high-profile exceptions last fall). In the commercial office space, banks are recognizing charge-offs but these are in line with the loss reserves previously established (i.e., no further impact on earnings or book value).
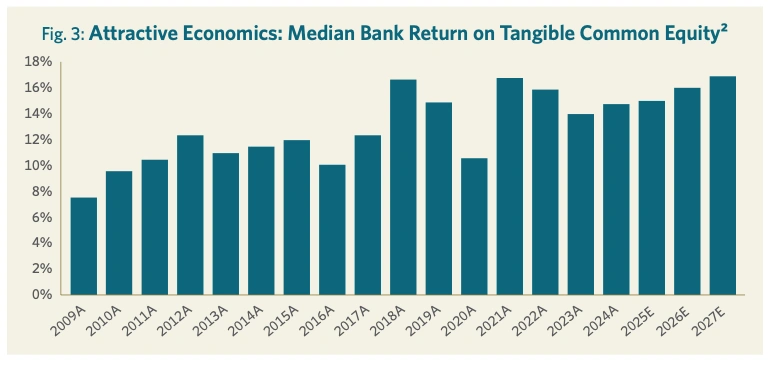
On profitability, interest spreads have begun widening again as the banks’ fixed rate assets have been rolling over at higher yields, revealing the attractive economics of their low-cost deposit franchises. Furthermore, banks have generally been able to slow the rate of growth in their expenses of late, in part through investment in their technology infrastructure (and the adoption of AI into their labor-intensive operations could cement this trend for some time to come). Many banks are currently generating returns on tangible equity in the mid-to-high teens, and management comments and targets suggest that this level should be sustainable in the medium term (or longer), as shown in Figure 3.
The regulatory environment has been moving in a favorable direction as well (although arguably this was being discounted in stock prices already at the end of last year). Capital rules being finalized seem set to be far less onerous than they would have been under the prior administration, which contributes to managements’ optimistic outlooks for their ROEs. Regulators are more willing to consider M&A transactions, and there has been relief on certain supervisory limitations.
We try in our work to differentiate between intrinsic value and market value. Some of the trends observed in 2025 do represent positive changes to our estimate of intrinsic value at our portfolio companies. But many of them have been incorporated into our analysis of intrinsic value for quite some time, and it is only now that the market is seemingly recognizing them. Hence, the strong market returns experienced over the last year make it fair to say that the gap between intrinsic value and market value at many financial companies—although it still remains—has narrowed.
Portfolio Positioning:
Trimming and Redeploying
Banks, both domestic and foreign, continue to represent the majority of our holdings in the DFNL portfolio. However, given their strong market performance during the year, we have trimmed our exposure to banks (primarily BNY Mellon, DBS and Danske) and redeployed that capital into property & casualty reinsurers (Everest Group and RenaissanceRe), select payments-related companies (Fiserv and Chime) and a family-controlled investment holding company, Exor.
Many of our core holdings remain the same as a year ago. Capital One continues to be the largest position in the portfolio. Its transformational acquisition of Discover Financial closed in May 2025. In addition to targeting annual cost synergies of $1.5 billion, management is anticipating so-called “network” synergies of $1.2 billion from transitioning certain Capital One debit and credit card volumes into Discover’s networks. Importantly, the latter synergy target is based on transitioning only a minority of Capital One’s credit card volume. Longer-term, we think the company has an opportunity to continue integrating its card-issuing activities with its card network. Looking out a few years we believe Capital One remains attractively priced at less than 10x earnings despite the potential, in our view, to earn +/-20% returns on tangible capital on average and over time.
Wells Fargo is the largest “traditional” bank in our portfolio. The company passed a milestone this year with the removal of the asset cap imposed by the Federal Reserve that has been a governor on its growth. Just as importantly, Wells Fargo has made progress over several years in right-sizing its cost structure. It has also seen positive momentum in the business lines it has recently been investing into (investment banking, credit cards and wealth management). The bank has a surplus of capital which it is working down through share repurchases, which will enhance earnings per share growth over the medium term. Despite the stock’s +36% return in 2025, Wells Fargo’s valuation at 2.1x tangible book value remains reasonable for a bank that ought to earn a high-teens return on tangible equity over time. The other so-called “super-regional” banks in the portfolio (Fifth Third Bank, U.S. Bancorp and PNC Financial) are trading at similar or better valuations, and we remain optimistic about their prospective returns.
Chubb is one of our core property & casualty insurance holdings. It is well-diversified across products and geographies. The company has consistently generated returns on equity comfortably ahead of the industry owing to a combination of running advantaged lines of business with a disciplined underwriting and operating culture. Pricing trends in the insurance markets have generally been strong in recent years, and consequently Chubb has been earning returns on tangible equity in the low 20s. While competitive forces may in time push that back toward a “normalized” level a few points lower, Chubb we believe would still be valued at 10–11x earnings looking out a few years.
After three consecutive years of strong investment returns in financials, it’s inevitable that the gap between market price and our estimate of intrinsic value would narrow. However, since the portfolio in aggregate is valued at approximately 13x this year’s earnings—a significant discount to both the broader S&P 500 Index and the S&P Financials Index—we continue to believe it has the potential to generate attractive returns over the next decade.
Outlook:
Durable Across Outcomes
We remain consistent in our approach to allocating capital in our portfolio—that is, we look for companies with durable competitive advantages coupled with competent and honest managements that are priced at a discount to their intrinsic value. We invest presuming that we will own our companies through business cycles. We do not attempt to build a portfolio around a particular speculative forecast—for example, by trying to predict where interest rates or the economy will go. Rather, we strive to construct a portfolio that we believe can perform well over the long term across a range of economic outcomes. As such, our portfolio is diversified across leading franchises earning above-average returns on capital in banking, payments, custody, wealth management and property & casualty insurance. We remain excited by the investment prospects for the companies in Davis Select Financial ETF.
Together on This Journey
We have navigated a constantly changing investment landscape guided by one North Star: to grow the value of the funds entrusted to us. We are pleased to have achieved strong results thus far and look forward to the decades ahead. With more than $2 billion of our own money invested in our portfolios, we stand shoulder to shoulder with our clients on this long journey.3 We are grateful for your trust and we feel we are well-positioned for the future.
DFNL Davis Select Financial ETF
Annual Review 2026
Managers