
Key Takeaways
- Davis Select Financial ETF (DFNL) returned +13.03% in the first half of 2025, exceeding the performance of the S&P Financials Index which returned +9.23%, and the S&P 500 Index, which returned +6.20%.
- Investors’ fear—primarily related to trade policy—drove an intra-half -19% peak-to-trough drawdown in the S&P 500 Index, and bank stocks reacted similarly owing to potential second-order impacts on credit. However, the sentiment was short-lived and share prices had recovered by the end of the half.
- There continues to be significant dispersion in stock valuations. This may be most apparent in the valuations of large U.S. technology companies but is also noticeable within the S&P Financials Index. The companies in the portfolio are valued in aggregate at a significant discount to the overall market.
- We believe that our portfolio companies are well-positioned to withstand an eventual recessionary environment. Though short-term market fluctuations are unpredictable, our companies’ valuations are sufficiently low that we think they should be able to generate attractive returns over the next decade.
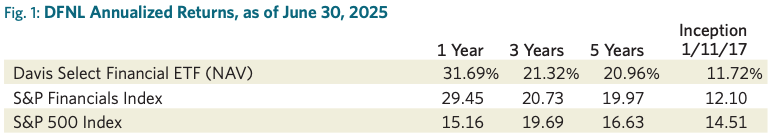
The average annual total returns for Davis Select Financial ETF for periods ending June 30, 2025, are: NAV Return, 1 year, 31.69%; 5 years, 20.96%; Inception (1/11/17), 11.72%; Market Price Return, 1 year, 32.11%; 5 years, 21.05%; Inception, 11.74%. The performance presented represents past performance and is not a guarantee of future results. Investment return and principal value will vary so that, when redeemed, an investor’s shares may be worth more or less than their original cost. For the Fund’s most recent month end performance, visit davisetfs.com or call 800-279-0279. Current performance may be lower or higher than the performance quoted. NAV prices are used to calculate market price performance prior to the date when the Fund was first publicly traded. Market performance is determined using the closing price at 4:00 pm Eastern time, when the NAV is typically calculated. Market performance does not represent the returns you would receive if you traded shares at other times. The total annual operating expense ratio as of the most recent prospectus was 0.63%. The total annual operating expense ratio may vary in future years.
This material includes candid statements and observations regarding investment strategies, individual securities, and economic and market conditions; however, there is no guarantee that these statements, opinions or forecasts will prove to be correct. All fund performance discussed within this material are at NAV and are as of 6/30/25, unless otherwise noted. This is not a recommendation to buy, sell or hold any specific security. Past performance is not a guarantee of future results. There is no guarantee that the Fund performance will be positive as equity markets are volatile and an investor may lose money.
Strategy:
Growth in Disguise
Davis Select Financial ETF (DFNL) invests in durable, well-managed financial services companies at value prices which the portfolio could hold for the long term. Shelby Cullom Davis’s quip that financial services companies can be “growth companies in disguise” remains a bedrock tenet of our approach. Investors tend to place low valuations on financial companies because of their earnings volatility. However, many financial companies generate capital through the business cycle at an attractive rate which they use to pay dividends, buy back stock or otherwise deploy in ways that increase shareholder value. By focusing on economic reality rather than investor sentiment, DFNL has compounded shareholder wealth at +11.72% annually since its inception in January 2017.
First-Half Results:
There and Back Again
The S&P 500 Index returned +6.20% in the first half of 2025. The proverbial casual investor who only checks their 401(k) balance on occasion might be forgiven for concluding that it was an uneventful six months. The reality of course is far different. Among other things, the U.S. became embroiled in a trade war—initially focused on China, Canada and Mexico but widened globally on Liberation Day—whose outcome remains uncertain, but which could reasonably upend longstanding supply chains and depress consumer demand. There were dramatic moves in long-term U.S. Treasury yields both up and down (though ultimately the 10-year Treasury yield ended the first half more than 30 basis points lower than it was at the start of the year). Conflict in the Middle East re-escalated. The S&P 500 Index saw a -19% peak-to-trough drawdown during the period, although prices had fully recovered by the end of the first half.
With a +9.23% return, the S&P Financials Index outperformed the S&P 500 Index in the first six months of 2025. The strongest performers were selected banks (notably JP Morgan Chase, Citigroup and Wells Fargo), investment banks, exchanges and consumer finance companies. Alternative asset managers, selected payments companies and regional banks lagged. The financials index experienced a similar steep drawdown (and recovery) as the broader index. Financial companies—and regional banks in particular—don’t have significant direct exposure to tariffs but obviously could experience a second-order impact in the form of rising credit losses and a slowdown in loan growth. However, the -23% drawdown in the S&P Banks Select Industry Index during the first half seemed overdone to us. It was another illustration of our long-running contention that memories of the 2008–09 financial crisis still weigh on investors, making them leery of financial stocks.
As noted, DFNL outperformed the S&P Financials Index with a return of +13.03%. The biggest contributors to our relative performance were our foreign banks (Danske Bank, DNB Bank, and DBS Group), selected U.S. banks (JP Morgan Chase and Wells Fargo), Capital One and capital markets company BNY Mellon. The portfolio’s largest detractors were U.S. regional banks (U.S. Bancorp, Fifth Third and PNC Financial), Everest Group, Renaissance Re and Chime.
Market Environment:
Business Developments
We disclose in these letters the market performance of the portfolio and relevant benchmarks. But we also like to reference Ben Graham’s famous observation: “In the short run, the market is a voting machine, but in the long run, it is a weighing machine.” We are most concerned with how the intrinsic value of our companies develops, and accept that there will be periods (sometimes quite lengthy ones) where market value and intrinsic value diverge. The market performance of the portfolio and the S&P Financials Index over one-, three- and five-year periods is quite likely to have exceeded the growth in intrinsic value. However, the longer-term returns seem to represent intrinsic value more closely.
It is often difficult to observe the rate of change in intrinsic value over short periods of time such as a year or six months. The signal can easily be drowned out by the noise. However, we think the recent period has been notable for the number of significant events at core portfolio holdings that could be positive catalysts for growth in intrinsic value.
Capital One closed its acquisition of Discover Financial in May of this year. This is a transformative deal for the company in which the pro forma ownership is split approximately 60/40 between Capital One and Discover shareholders. Such large deals often give us pause but, in this case, we are comforted by our trust in the Capital One management team led by Richard Fairbank, the reasonable relative valuation between the two stocks, and the strategic logic of the deal. In addition to targeting cost synergies of $1.5 billion, management is anticipating so-called “network” synergies of $1.2 billion from transitioning certain Capital One debit and credit card volumes into Discover’s networks. Importantly, this synergy target only envisions a minority of Capital One’s credit card volume transitions. Longer-term, though, we think the company has an opportunity to continue integrating its card-issuing activities with its card network. There will undoubtedly be noise in their near-term results—both from integration costs and accounting oddities. However, looking out a few years we believe Capital One remains attractively priced at less than 10x earnings despite the potential, in our view, to earn +/-20% returns on tangible capital on average and over time.
Wells Fargo was released (after seven years) from the asset cap that the Federal Reserve imposed on it. It has been difficult to accurately gauge what impact the asset cap had on the bank’s ability to service customers. The bank had avenues to attract and retain the most attractive parts of a client’s business (from a return-on-assets perspective). But inevitably Wells Fargo must have been losing out at the margin, and with the passage of time and the underlying growth in the core parts of their client franchise, the asset cap surely had begun to bite. Getting out from under the asset cap will undoubtedly be positive for the bank from a client service and revenue perspective. Just as significant, we think, is the signal from the Federal Reserve that Wells Fargo is well on its way to improving its compliance and controls infrastructure. It can be difficult from the outside to point to exactly where in the income statement this improvement will appear, but it is an important milestone in the bank’s march to its medium-term target of 15% return on tangible equity (and beyond).
Markel Group is a property and casualty insurer that carries a significant amount of excess capital allocated to a portfolio of public equities and controlling interests in private, middle-market companies (leading some to call it a “mini-Berkshire Hathaway”). During the first half it announced that its board would conduct a review of its businesses. This followed the emergence late last year of a so-called activist investor who advocated for the sale (most likely to a leveraged private equity fund) of the company’s portfolio of wholly owned, well-run, non-insurance businesses. In our view such a sale would be a serious mistake for two reasons. First, given that private equity firms create value by buying undervalued businesses, it stands to reason that selling undervalued businesses to them would destroy value for Markel shareholders. Second, this portfolio of diversified companies adds a welcome third engine to Markel’s growth and stability, allowing them to absorb the volatility inherent in insurance underwriting cycles and the short-term swings in investment returns. As long-term shareholders, we wholly endorse this three-pronged strategy that has been tested and resilient over the last two decades. Given Markel’s extraordinary culture of stewardship and candid communication with shareholders, we expect the vast majority of other long-term shareholders endorse it as well. That said, we do think that the involvement of an activist investor aligns with our thesis that there is a meaningful gap between the company’s stock price and its intrinsic value.
Rocket Companies, the nation’s largest mortgage originator, announced two notable acquisitions in the first half of the year—Mr. Cooper, the largest U.S. mortgage servicer, and Redfin, a leading digital real estate brokerage firm. Beyond the financial rationale for the deals, management has a vision for fundamentally streamlining customers’ home ownership experience. Existing Rocket shareholders will own approximately 70% of the pro forma company once the dust clears. As we noted with respect to Capital One above, we do get nervous when companies engage in such adventures. In the case of Rocket, we take comfort from the oversight and alignment of interests of Rocket’s founder and controlling shareholder, Dan Gilbert.
The pace at which the gap between market price and intrinsic value will close is beyond our control. Danske Bank, which was among the strongest drivers of portfolio performance so far this year, is a good illustration. We first purchased Danske Bank for the portfolio in 2020. At the time, the bank was under a cloud owing to violations of anti-money laundering rules by its Estonian subsidiary. In the ensuing years, Danske had to undergo comprehensive change in the management team, settle a large monetary penalty with regulators, and commit significant resources to enhancing its risks and controls infrastructure. While some of these milestones were achieved a few years back, the stock valuation only began to “re-rate” over the last year or so. With Danske stock up +35% in its local currency in the first half, the gap to intrinsic value has continued to narrow, though we still believe the shares are reasonably priced at 1.3x tangible book value.
We could not possibly end a discussion of the noteworthy developments at our portfolio companies without acknowledging Warren Buffett’s decision to hand over the CEO position at Berkshire Hathaway to Greg Abel at the end of this year. Berkshire’s compounded annual return over Warren’s tenure from 1965 through 2024 was 19.9%, compared to 10.4% for the S&P 500 Index.1 Moreover, Berkshire stock outperformed the index in 46 out of 56 annual rolling five-year periods, and in 43 out of 51 annual rolling 10-year periods. Size undoubtedly played a role in narrowing the potential for outperformance of Berkshire stock as time progressed, a point Warren himself has been making since at least 1982. However, the consistency in the company’s performance is staggering. As shareholders, we are grateful for Warren’s stewardship, and as students we are grateful for his patient teaching.
Valuation:
Dispersion Continues
We noted above that stock prices have increased faster than intrinsic value has grown in the last five years. This largely reflects just how low stock prices were at the starting point in June 2020—not quite the market depths of COVID, but still dire. Today we continue to believe our companies’ valuations are sufficiently low that they could generate attractive returns over time from here.
While index valuations—both the broader market index and the S&P Financials Index—seem high by historical comparison, both are still heavily influenced by the dispersion in valuations. The dispersion in the S&P 500 Index caused by the Mag 7+1 companies (see Figure 2) is generally known. They collectively trade at 32.5x earnings. There is also dispersion within the S&P Financials Index. Approximately 35% of the companies in the S&P Financials Index (weighted by market capitalization) traded at a multiple higher than 21x 2025 forward earnings at the end of the first half, and their weighted average P/E multiple was 28.9x.2 Included in this group were the payment networks, alternative asset managers, financial data companies, financial software providers, insurance brokers and exchanges. Many of these are very high-quality companies whose business models and management teams we admire. Stocks trading at such valuations can still be very compelling investments depending on their growth trajectory and the economics of their business, in which case we would happily be (and are) shareholders. Each of these companies has a story, and some of them might even come true. However, in our experience, it would be extremely difficult for the vast majority of these companies to all grow into such a rich valuation.
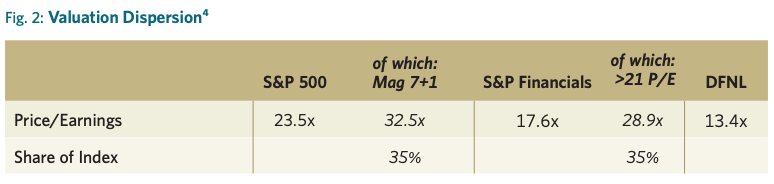
DFNL’s holdings skew toward the types of businesses that make up the other 65% of the S&P Financials Index, namely U.S. money center and regional banks, consumer finance companies, property and casualty insurers, wealth managers, and banks. These companies are more balance sheet-intensive and should earn lower returns on capital. They bear credit and underwriting risk so their returns can be lumpy (though that isn’t necessarily negative: regular readers of these letters may recall that we often say we prefer “a lumpy fifteen to a smooth twelve”). They are regulated. These companies should trade at a valuation discount but with the portfolio’s weighted average P/E multiple at 13.4x3 we believe both that the discount is too wide and that the prospective absolute returns on our portfolio from here have the potential be more than satisfactory.
Outlook:
Durable Across Outcomes
We remain consistent in our approach to allocating capital in DFNL—that is, we look for companies with durable competitive advantages coupled with competent and honest managements that are priced at a discount to their intrinsic value. We invest presuming that we will own our companies through business cycles. We do not attempt to build a portfolio around a particular speculative forecast—for example, by trying to predict the direction of interest rates or the economy. Rather, we strive to construct a portfolio that will perform well over the long term across a range of economic outcomes. As such, DFNL is diversified across leading franchises earning above-average returns on capital in banking, payments, custody, wealth management, and property and casualty insurance. We remain excited by the investment prospects for the companies in Davis Select Financial ETF.
We have navigated a constantly changing investment landscape guided by one North Star: to grow the value of the funds entrusted to us. We are pleased to have achieved strong results thus far and look forward to the decades ahead. With more than $2 billion of our own money invested in our portfolios, we stand shoulder to shoulder with our clients on this long journey.5 We are grateful for your trust and are well-positioned for the future.
DFNL Davis Select Financial ETF
Semi-Annual Review 2025
Managers